As a followup to this article below, I’d like to go over how things have developed since then.
In the last article, I mentioned how the bond market was beginning to price rising rates. However, it’s sometimes difficult to tell whether that pricing is coming from a pricing of increased risk in equities, or a pricing of actual inflation. The 10Y rate has rocketed since last month and this macroeconomic trigger is hurting the extremely debt-ridden US corporations. To explain:
Currently, high yield credit spreads are at all-time lows (~3.2%) and Corporate Debt-to-GDP is at all-time highs (51%).
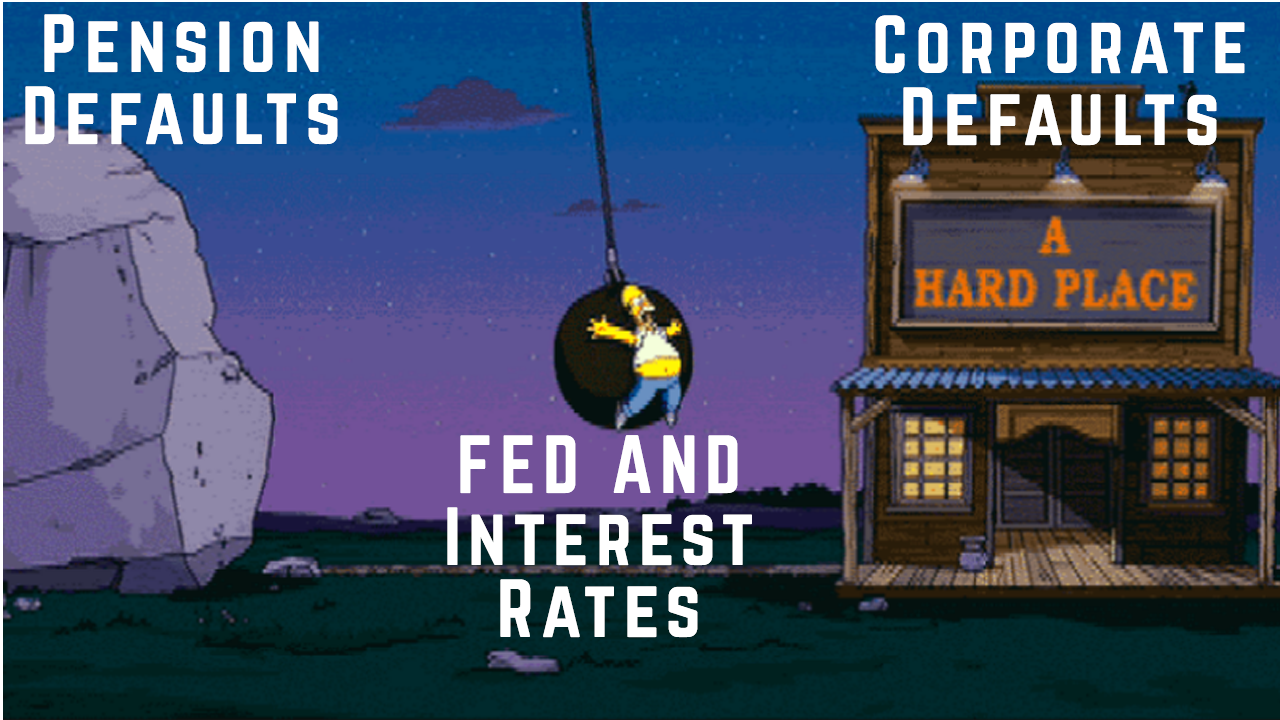
The Fed’s goal of 2% inflation is a narrow line between a ROCK (pension default due to low rates) and a HARD PLACE (corporations default if they can’t roll debt at low rates) There is no margin for error. To explain this better, I made a meme.
The 10Y says we’re moving to the corporate defaults.
To really understand just how leveraged US companies (and really all companies world-wide) are, we can take a look at just how much rates affect their profits.
A normalization of rates to pre-2008 levels would cause US Corporate Profits to collapse by 50% due to increased interest payments alone A move in rates back to 1970s peaks would result in the total elimination of all US corporate profits.
This is one of many facets of something most of you probably already know – that we’re in a debt bubble.
One argument against this is that in modern markets, the price of risk is set by liquidity/flows(buyers and sellers at a given time and place), and not solvency or fundamentals.
In theory, the Fed supplies liquidity to support the Jenga tower of credit risk until either:
1) Stagflation/Corporate Insolvency
2) Income Gap/Political Insolvency
3) Pension insolvency
4) Hyperinflation
Instead of letting one of these scenarios play out during the unexpected coronavirus pandemic crash, the Fed injected more liquidity and free credit into the markets than it ever has in history. What this did was ultimately push major credit risks back a year or so and now we are to face similar problems; but with the added issues of a major wealth inequality increase, asset bubbles across the board, even higher debt-gdp ratios, universal retail speculation, and commodity prices going berserk.
Here are some examples of bubbles created by the massive Fed liquidity injection.
While there is certainly inflation, this inflation remains stuck in commodities, real-estate, and houses – and is not yet translating to consumer prices, or income growth. This could be compared to the 1970’s stagflationary environment. A scenario like this is negative for the stock market as incomes and real economic growth are not happening due to high unemployment, but rocketing commodity and goods/services prices.
If only comparing this asset bubble to other asset bubbles, we could witness some other similarities.
Perhaps the comparison to the 2020 pandemic crash is just much too obvious to come true. But the resemblance is striking, no?
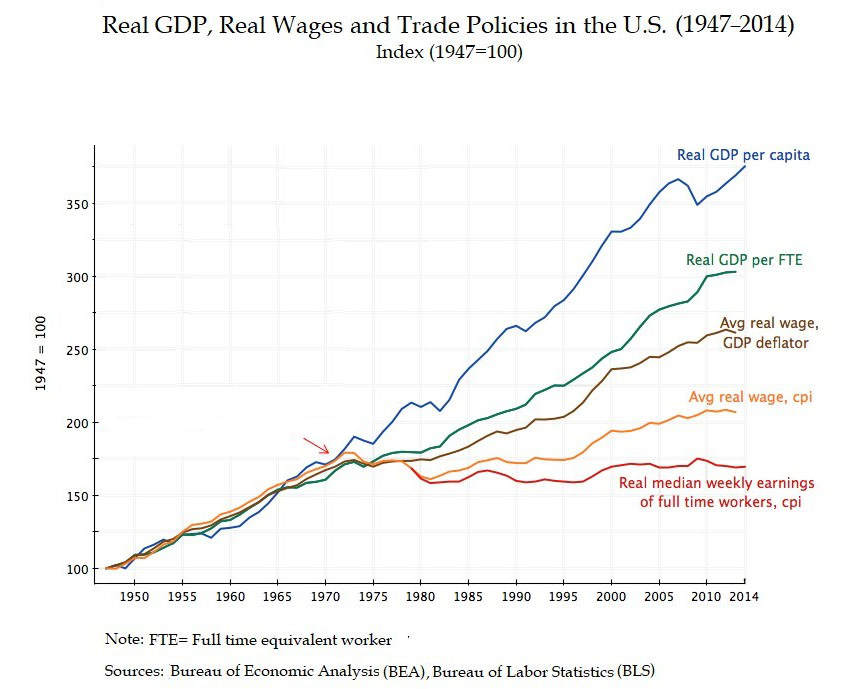
Really, you have to wonder if something must be off when you consider that the S&P 500 Index denominated in gold today is below the 1971 high.
Real wages for the American middle class have also been stagnant since that year. Amazing that after 40 years of incredible human technological progress, a bar of gold buried in the sand has outperformed the stock market.

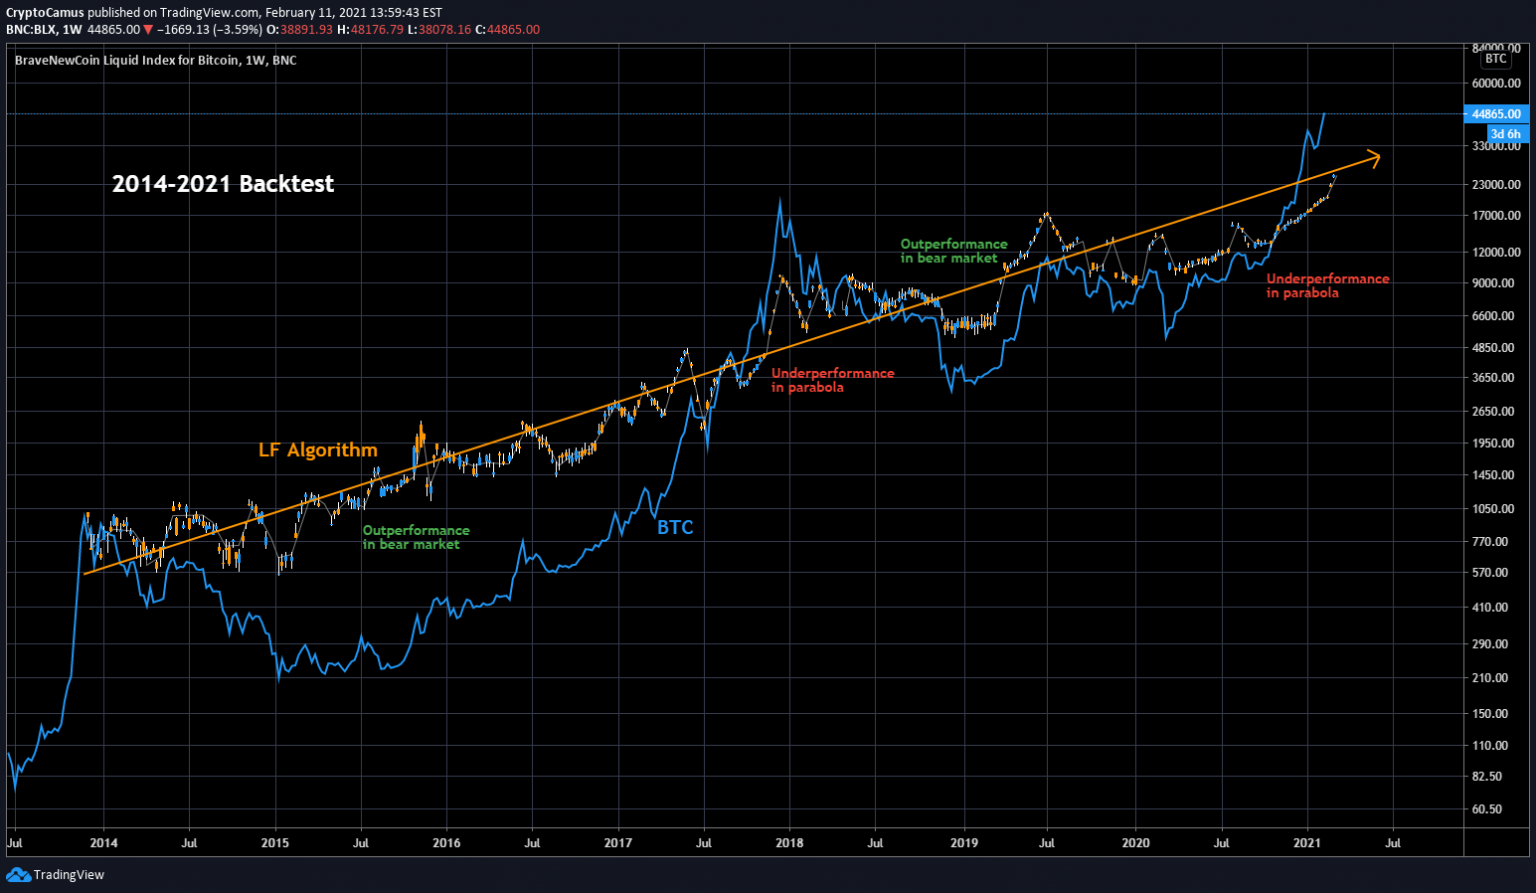
Why Care? Markets and Bitcoin Move Together – More or Less
And Ethereum has flashed some warning signs as well.
Things might not be quite over yet though, buyers are more than likely to step in sooner than later – but they’ll be on the defense. As long as Bitcoin remains above $35,000, we can remain in a long term uptrend, and perhaps even run for $100,000. However, if the stock market does choose to fall into a crash scenario in the coming months, I doubt Bitcoin will remain immune. This is when the algorithm proves most valuable.
In the short term, I think it’s likely markets consolidate and bounce a bit from this region here, perhaps even a slingshot back to the 3900’s on SPX – but ultimately the picture looks more dangerous over the long term.
4 comments
Nate
You are my top indicator
Jason Johnson
Nice read, great meme, that 70’s divergence is real, are we headed to 20% interest rates? Enquiring minds want to know!
Alex Johnson
Ha, I think not. Different yield environment entirely, but similar in terms of lack of push-demand and rising producer prices.
Higher yields definitely seem like they’re in the picture though.
DOLORES MARY JOHNSON
The basic problem is the Fed’s inability to measure the developments with reason and historic analysis. What we have experienced in the past is hysteria at the Fed.