Markets have become increasingly convoluted over time via trading algorithms, big hedge-funds, market makers, etc. However, the basis of all markets resides in human emotion. Patterns of psychological actions show up over and over again across all asset classes – not just bitcoin. Bubbles of irrationality form, and violent fear-fueled crashes collapse markets and punish emotional traders / investors.
For a while I’ve been working on a culmination of signals to give me an idea of where we are in the market cycle (as bitcoin goes through very obvious market cycles), and I’d like to share the results.
The first is a simple signal; bring the concept of a P.E. Ratio from traditional markets to Cryptocurrency Markets. A price to earnings ratio or P.E. evaluates a company by comparing how much it earns to what the price is trading at. To do this in Cryptocurrency, we have to look at the network value. This can be seen by taking the total number of coins in circulation divided by the spot price of bitcoin. If we then divide that network value by it’s intrinsic value, which arguably is how much it is used. This is manifested in the number of transactions done on the network.
NVT Signal
This is called the NVT ratio. Network Value / Number of Daily Transactions. Simply, The price of the network / it’s usage.
If you take the NVT ratio, and derive it over a 90 day moving average; you actually get a very useful trading signal that has pinpointed every historical top and bottom in bitcoin’s history.

The NVT signal can be seen on the bottom of this chart. The green areas are bull markets, whereas the red areas are bear markets. Every time the NVT flashes red, Laissez Faire changes it’s bias to the downside; and when it flashes green, it changes the bias to the upside.
I’ve been working on incorporating something new. The Crypto Fear and Greed Index
This index is relatively new and doesn’t have the historical support that the NVT does due to lack of data. However, it is still relevant as it has been calling the reversals for the last year during the bear market of 2018-2019. 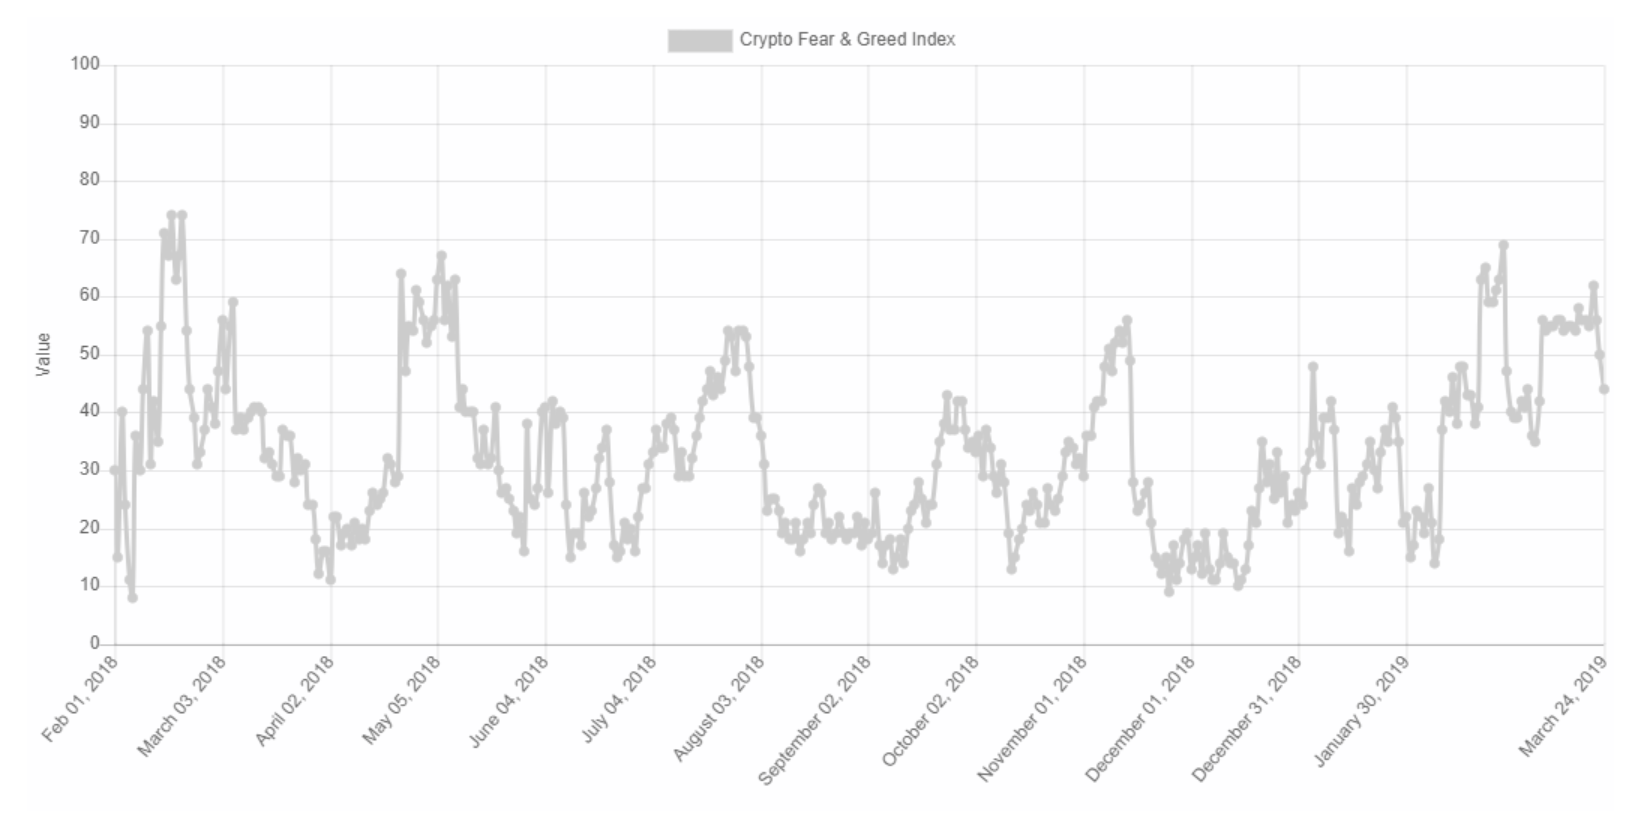
The Fear and Greed index works much differently than the NVT because instead of looking directly at fundamental valuations; it aims to measure sentiment among investors and traders.
I’m using https://alternative.me/crypto/fear-and-greed-index/
They gather data daily to create this signal and I’m working on adding it to the laissez faire bias change. From their site:
Why Measure Fear and Greed?
- Extreme fear can be a sign that investors are too worried. That could be a buying opportunity.
- When Investors are getting too greedy, that means the market is due for a correction.
Therefore, we analyze the current sentiment of the Bitcoin market and crunch the numbers into a simple meter from 0 to 100. Zero means “Extreme Fear”, while 100 means “Extreme Greed”. See below for further information on our data sources.
Data Sources
But let’s list all the different factors we’re including in the current index:
Volatility (25 %)
We’re measuring the current volatility and max. drawdowns of bitcoin and compare it with the corresponding average values of the last 30 days and 90 days. We argue that an unusual rise in volatility is a sign of a fearful market.
Market Momentum/Volume (25%)
Also, we’re measuring the current volume and market momentum (again in comparison with the last 30/90 day average values) and put those two values together. Generally, when we see high buying volumes in a positive market on a daily basis, we conclude that the market acts overly greedy / too bullish.
Social Media (15%)
While our reddit sentiment analysis is still not in the live index (we’re still experimenting some market-related key words in the text processing algorithm), our twitter analysis is running. There, we gather and count posts on various hashtags for each coin (publicly, we show only those for Bitcoin) and check how fast and how many interactions they receive in certain time frames). A unusual high interaction rate results in a grown public interest in the coin and in our eyes, corresponds to a greedy market behaviour.
Surveys (15%)
Together with strawpoll.com (disclaimer: we own this site, too), quite a large public polling platform, we’re conducting weekly crypto polls and ask people how they see the market. Usually, we’re seeing 2,000 – 3,000 votes on each poll, so we do get a picture of the sentiment of a group of crypto investors. We don’t give those results too much attention, but it was quite useful in the beginning of our studies. You can see some recent results here.
Dominance (10%)
The dominance of a coin resembles the market cap share of the whole crypto market. Especially for Bitcoin, we think that a rise in Bitcoin dominance is caused by a fear of (and thus a reduction of) too speculative alt-coin investments, since Bitcoin is becoming more and more the safe haven of crypto. On the other side, when Bitcoin dominance shrinks, people are getting more greedy by investing in more risky alt-coins, dreaming of their chance in next big bull run. Anyhow, analyzing the dominance for a coin other than Bitcoin, you could argue the other way round, since more interest in an alt-coin may conclude a bullish/greedy behavior for that specific coin.
Trends (10%)
Using Google Trends data for various Bitcoin related search queries and crunch those numbers, especially the change of search volumes as well as recommended other currently popular searches. For example, if you check Google Trends for “Bitcoin”, you can’t get much information from the search volume.